BIG DATA : Mapping a Town of 33km² with a drone

Flying a whole town of 33km² with a drone seems a big challenge to be taken up. As part of GISCAN ‘s Research and Development projectS, our team decided to carry out an experiment to evaluate the solution on such extended surface while testing its reliability in terms of flight effectiveness, data collection and time management.
- Though it is common business to process such volume of data in GIS, this initiative can be quite tricky for UAV users.
Preparation:
Blanquefort is the municipality where GISCAN’s head office is located. In fact, it is an essential asset since GISCAN has knowledge on ground control points that validate the data.
Given the area to be covered, flight planning software is mostly limited for this type of surface. For ease of creation, the flight plans were carried out jointly between the drone planning software and the GIS. It is more representative to display the projected flight plan in a local projection than a “standard” planetary projection.
[ngg_images source=”galleries” container_ids=”1″ display_type=”photocrati-nextgen_basic_thumbnails” override_thumbnail_settings=”0″ thumbnail_width=”240″ thumbnail_height=”160″ thumbnail_crop=”1″ images_per_page=”20″ number_of_columns=”0″ ajax_pagination=”0″ show_all_in_lightbox=”0″ use_imagebrowser_effect=”0″ show_slideshow_link=”0″ slideshow_link_text=”” template=”/var/www/html/wp-content/plugins/nextgen-gallery/products/photocrati_nextgen/modules/ngglegacy/view/gallery-caption.php” order_by=”sortorder” order_direction=”ASC” returns=”included” maximum_entity_count=”500″]
[ngg_images source=”galleries” container_ids=”2″ display_type=”photocrati-nextgen_basic_thumbnails” override_thumbnail_settings=”0″ thumbnail_width=”240″ thumbnail_height=”160″ thumbnail_crop=”1″ images_per_page=”20″ number_of_columns=”0″ ajax_pagination=”0″ show_all_in_lightbox=”0″ use_imagebrowser_effect=”0″ show_slideshow_link=”0″ slideshow_link_text=”[Montrer sous forme de diaporama]” template=”/var/www/html/wp-content/plugins/nextgen-gallery/products/photocrati_nextgen/modules/ngglegacy/view/gallery-caption.php” order_by=”sortorder” order_direction=”ASC” returns=”included” maximum_entity_count=”500″]
Realization of flights:
The flights were operated during the summer period of 2016 to have maximum sunshine and thus an optimal flight time. The flights are still limited to certain hours beyond which the photogrammetric result will not be ideal.
5 flights and 4 hours of flights on average per day over 5 days were carried out to carry out the mission. The first day was suspended due to violent wind with gusts that arose suddenly not making reliable the acquisition of data.
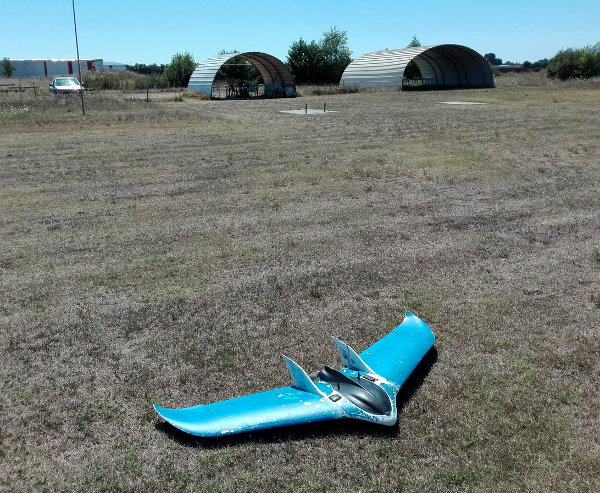
Drone flying wing of GISCAN at the end of the mission
Analysis of acquired data:
Flight logs and images were analyzed after each flight. The images are analyzed semi-automatically using a script created by Giscan that detects bad images (especially blur). This script facilitated the initial analysis of the 10,000 acquired images. The good knowledge of photographic techniques also made it possible to get rid of these possible worries.
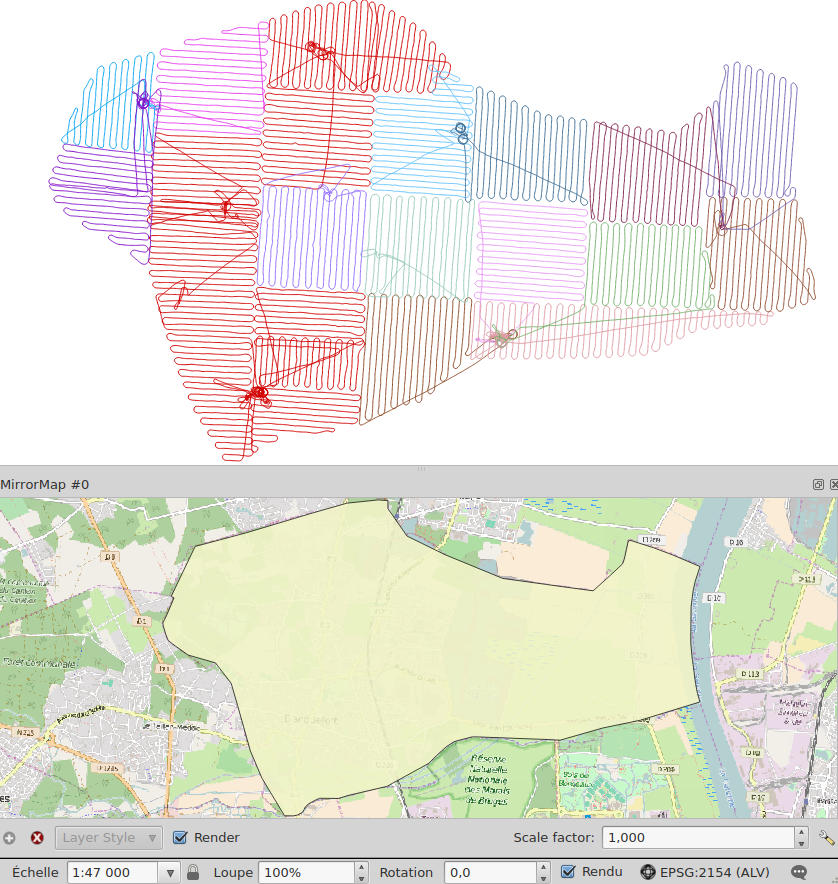
Flight logs showed in GIS software : Qgis
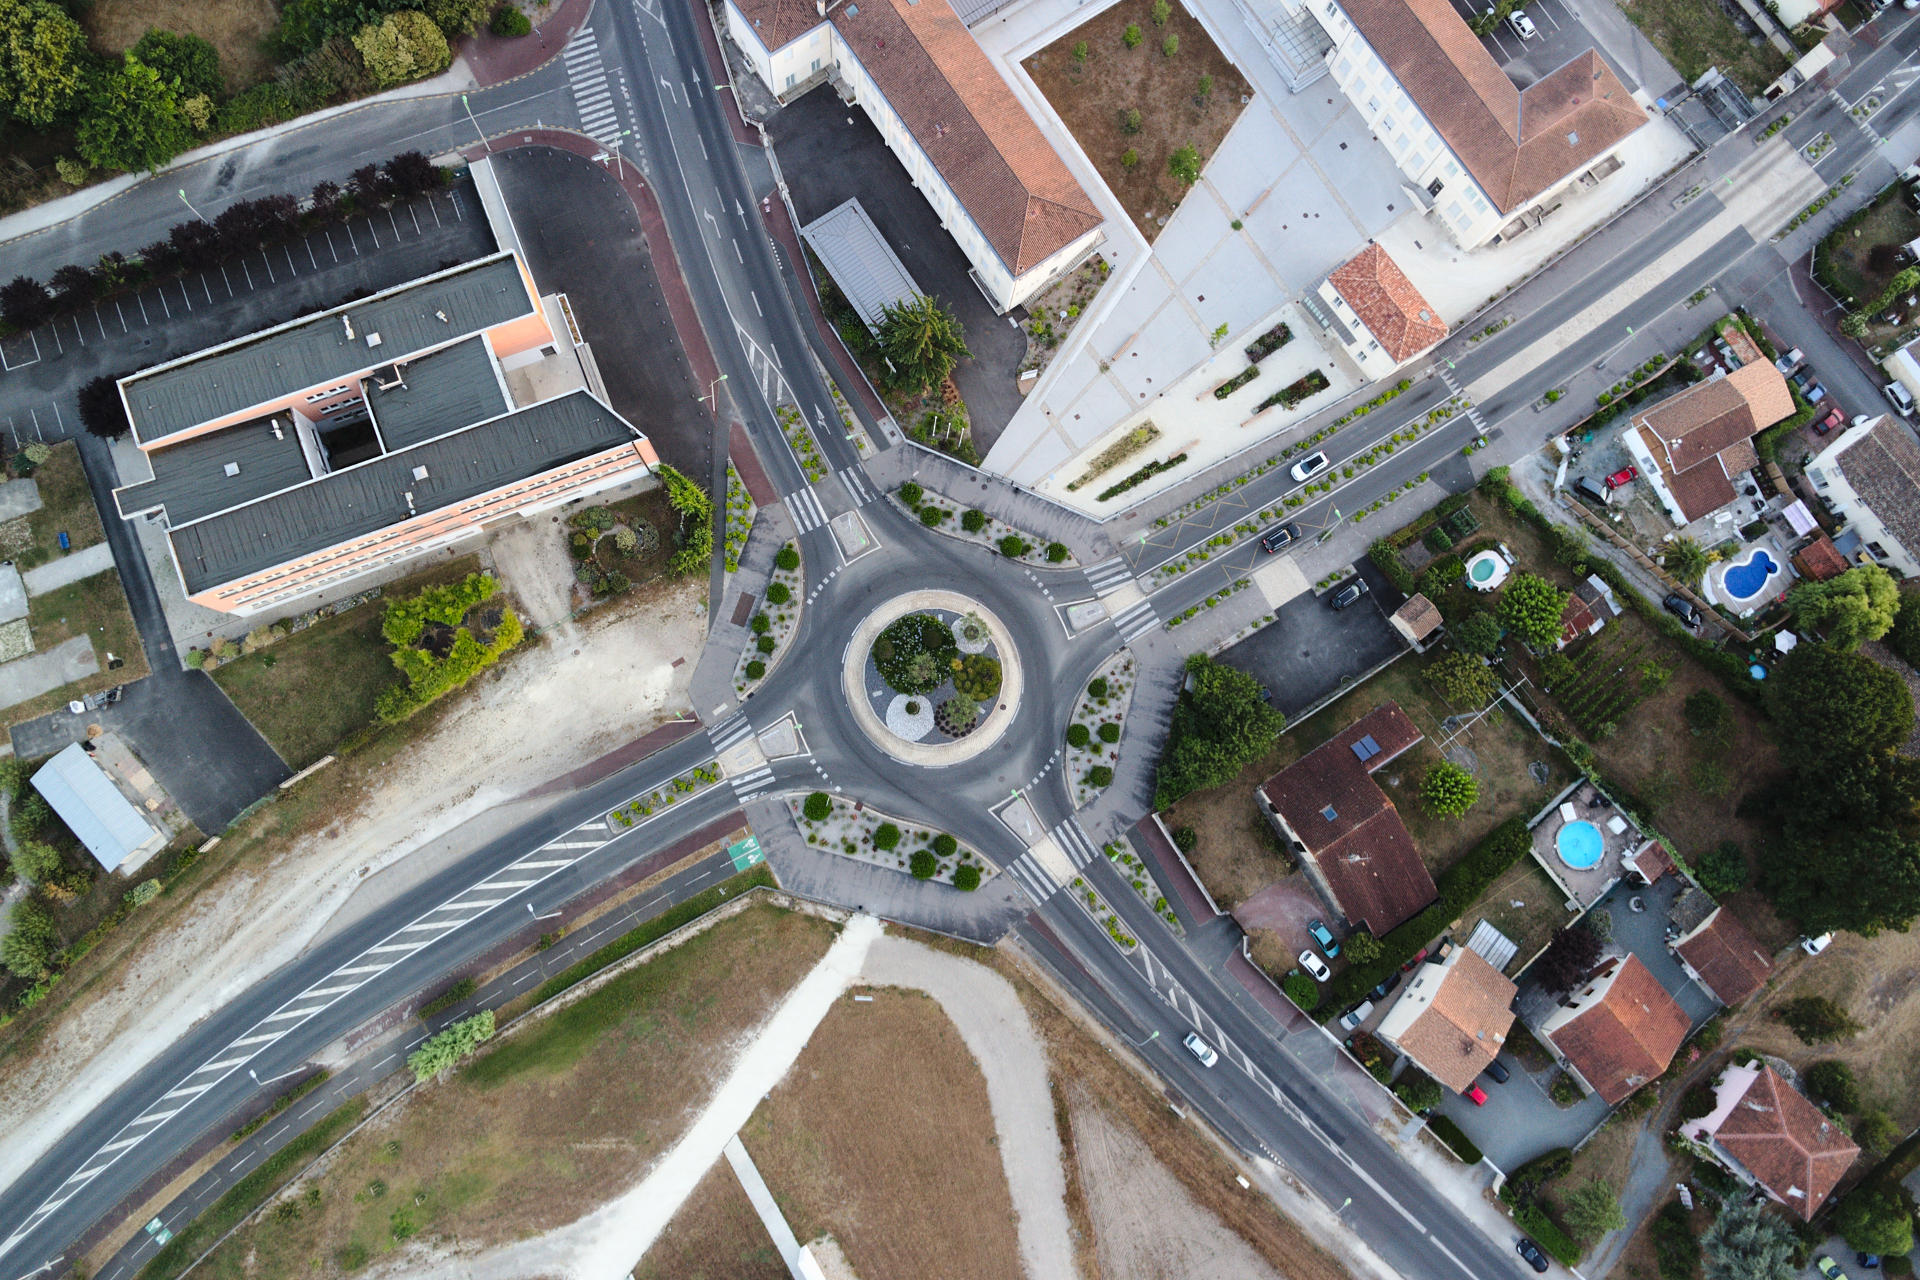
One of photo taken during automatic mission
Photogrammetric processing:
Photogrammetric processing on 10,000 images is somewhat slow. Unlike overflying small areas, such processing requires very high-performance computing tools. Although Giscan has multi-gpu machines (several graphics cards on the same computer), Giscan also used GIS tools to facilitate processing.
The processing of these data has nevertheless required 10 days and the setting up of a workflow for future projects of this scale.
(It is not mentioned in this article, the collection of ground control points to which 90 GCPs must be added and which took 3 additionnal days)
Images shown in photogrammetry software
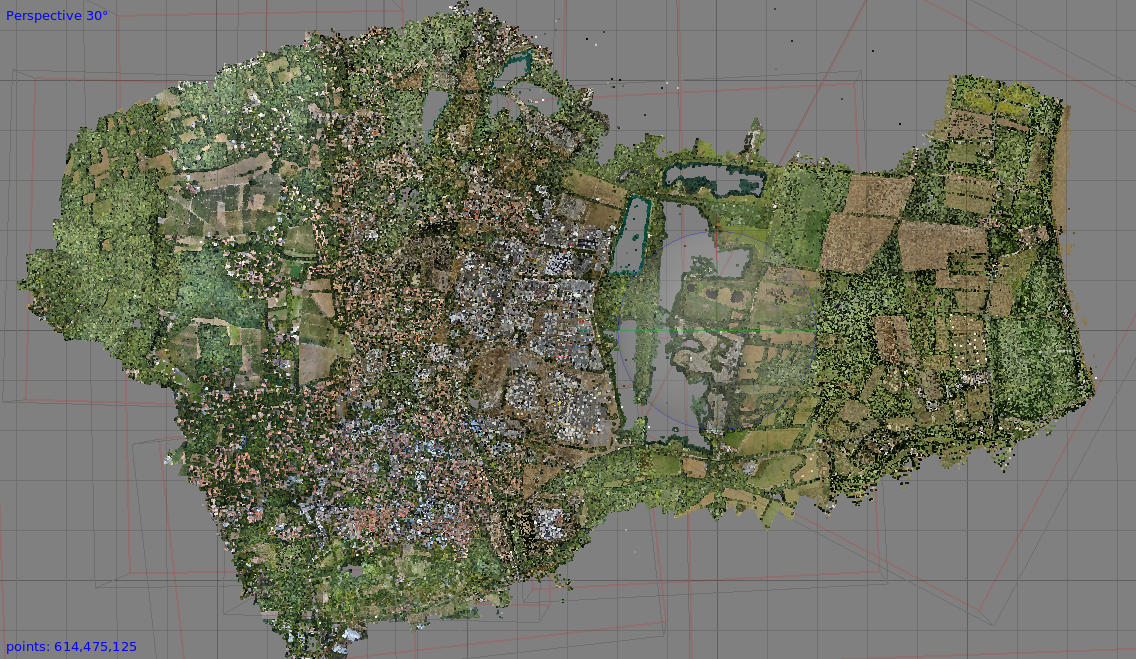
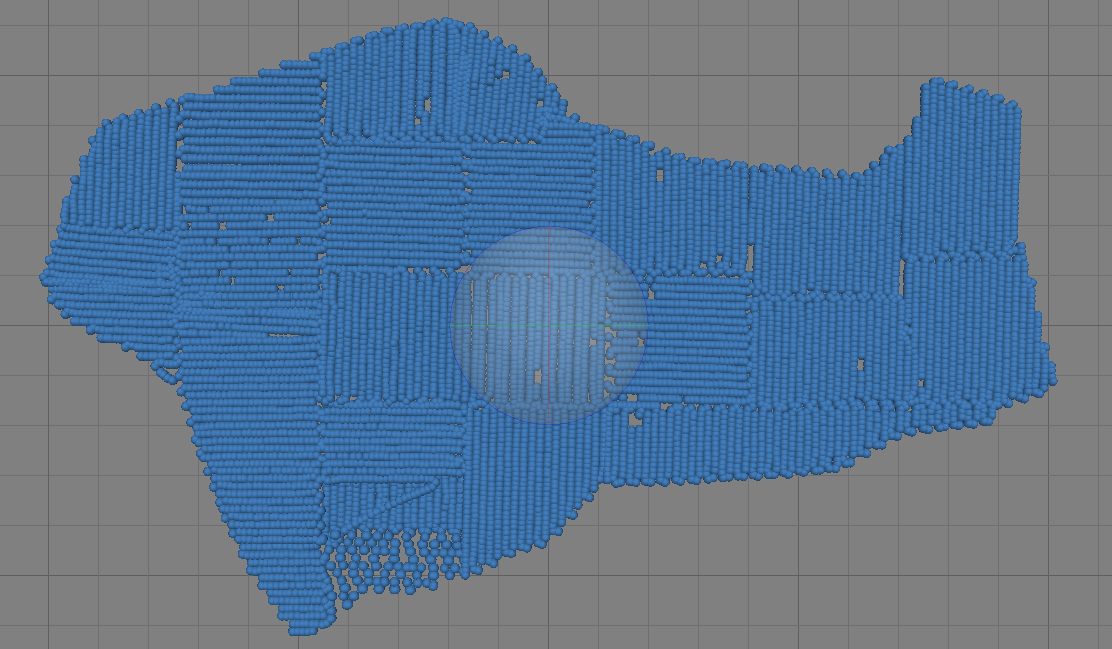
Point cloud
Results
The result of these flights and photogrammetric processing results in a 4cm / pixel orthophotography and a Digital Elevation Model at 8cm / pixel.
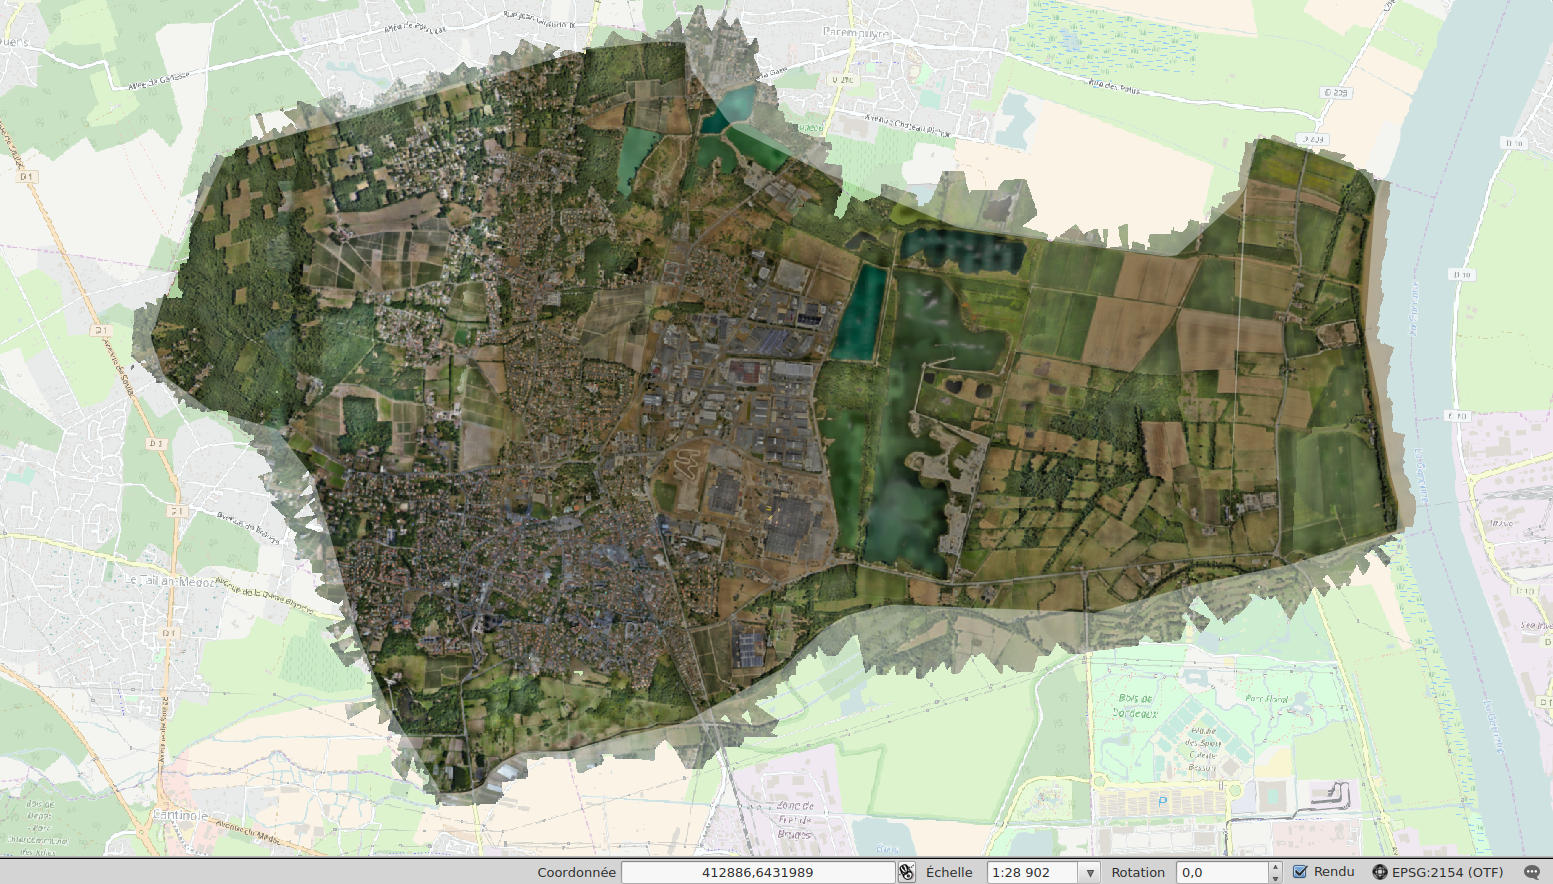
Orthophotography in GIS
Being able to produce working tools such as orthophotography and a digital elevation model on such a surface is quite exceptional. This speed changes the situation and vision of GISCAN to fulfill the missions entrusted to it by its clients. In most cases, data or data acquisition is no longer a problem and makes projects quickly operational.
Thanks to the drones, we can now produce very high resolution data. These data allow new practices and new uses when using data
What to do with a drone survey on the whole of a town ?
Flying over a municipality and acquiring accurate, reliable data and very high resolution is good but what to do with these data once acquired apart from archive them on a storage space to consult them later?
The 33km² evoked at the beginning of the article are located in the town of Blanquefort in New Aquitaine. This municipality has several types of space making it particularly interesting for a deeper data analysis than the standard products provided after photogrammetric process.
Find out in detail what it is possible to do with these data:
- High resolution 3d model : https://giscan.com/en/3d-model-from-drone-data/
- Viticulture : automated counting of vines. https://giscan.com/en/viticulture-automated-counting-of-vines/
- Still in wrinting process … come later please.