Monitoring the impact of a shipwreck: the case of the Wakashio bulk carrier
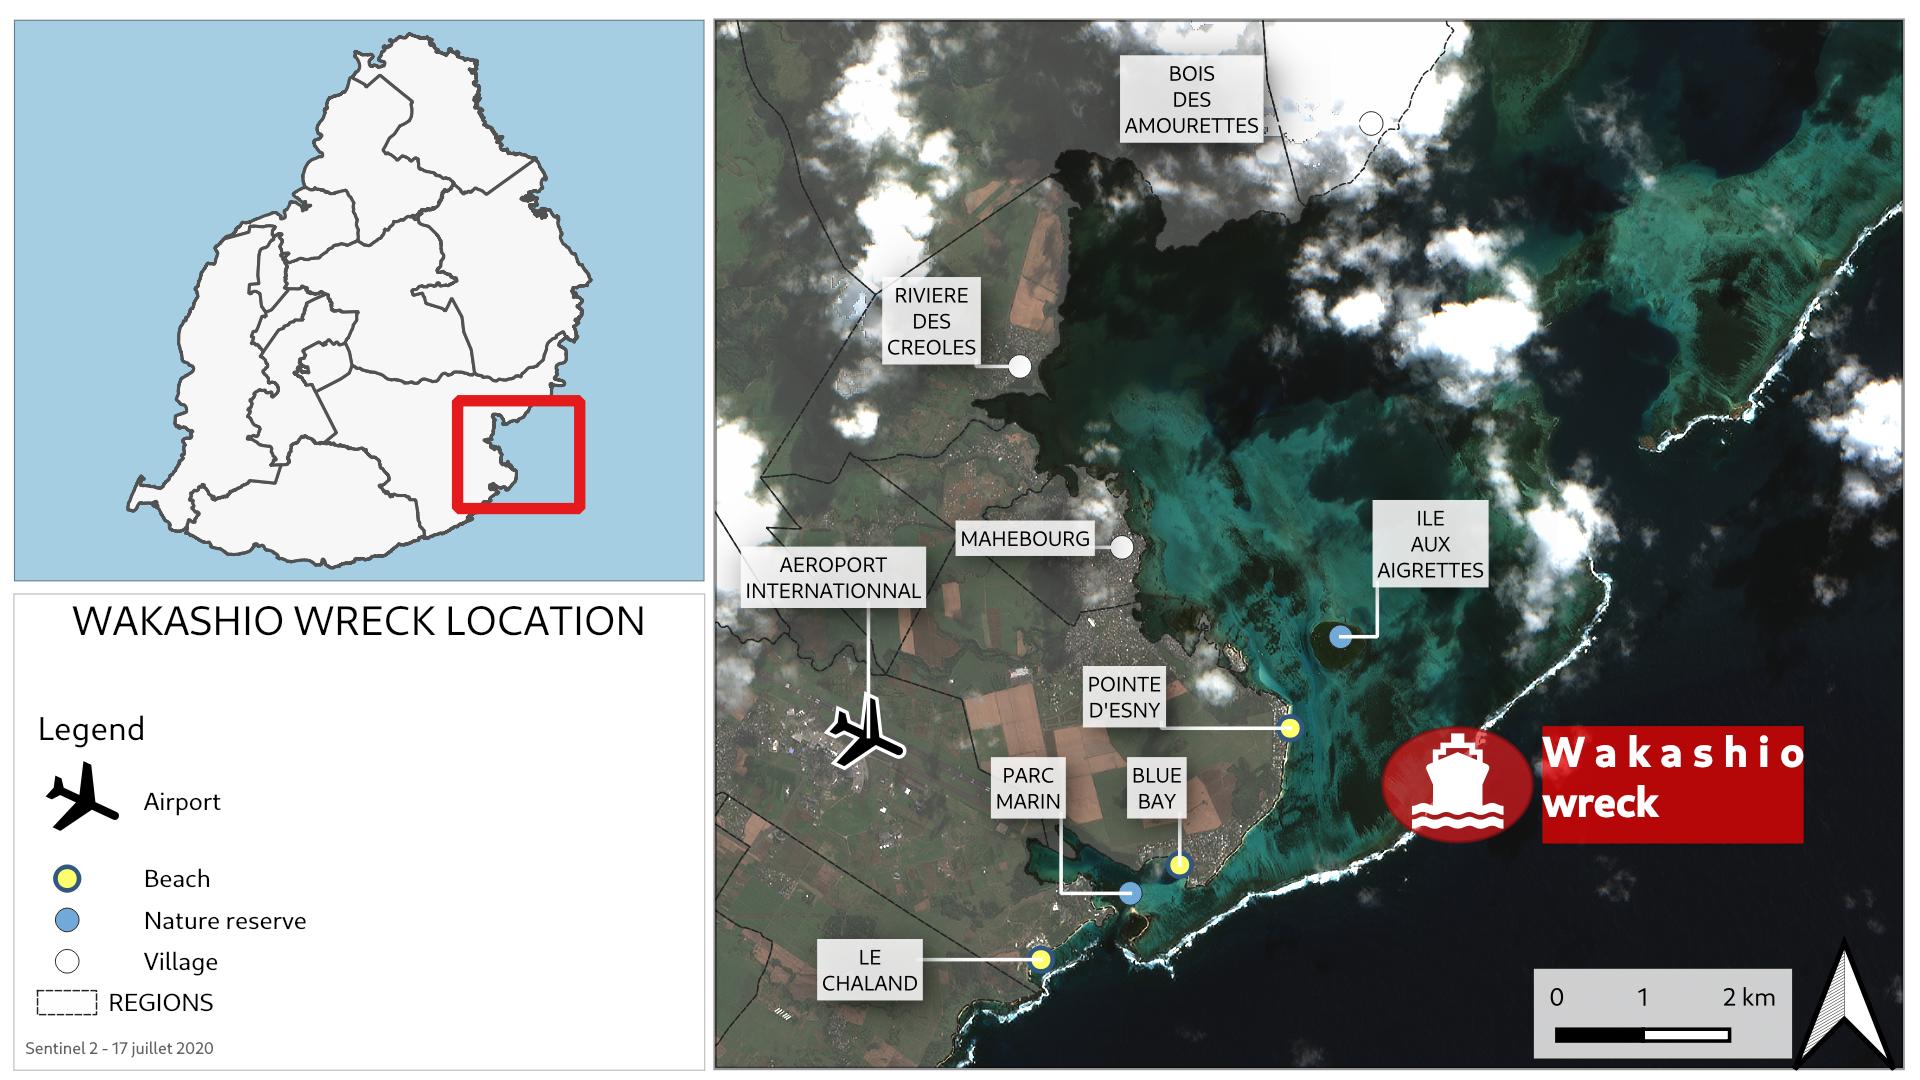
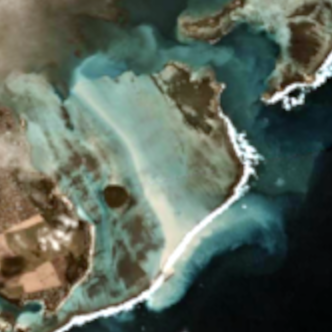
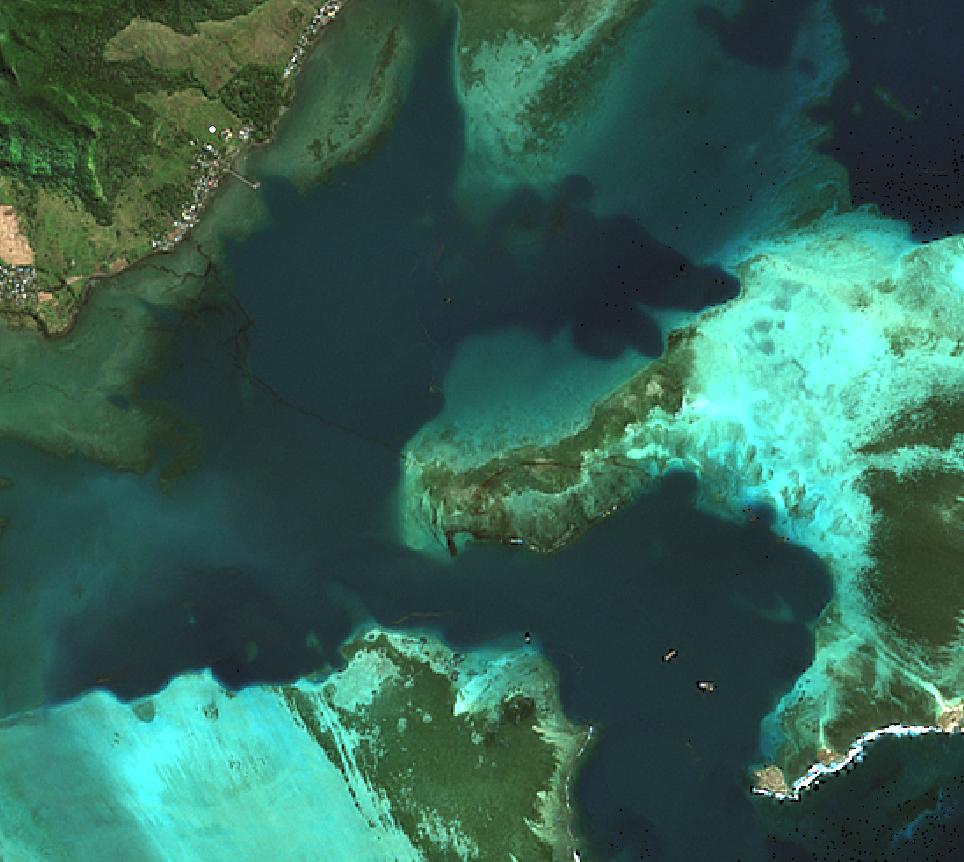
Satellite imagery of 17th July 2020 ( Sentinel 2) showing the lagoon at Pointe d’Esny before the MV Wakashio shipwreck
Cross-checking of various satellite sources for complete monitoring
Monitoring from several satellite sources is a common practice. Various images of high resolution coming from sources such as the European Sentinel Mission (from the Copernicus program) are readily available. We have attempted to use images from various sources to do a retrospective of the shipwreck of MV Wakashio on the 29th of July to the 11th of August 2020.
July 25 – day of the shipwreck: 86% of the imagery is covered by clouds. In fact, it is impossible to perform an analysis on this image. As such, we move on to the next target (common term used in remote sensing): that of the 29th of July.
Note: The SAR (Synthetic Aperture Radar) image from July 29 shows the vessel’s bearing. July 31st: This new image is particularly interesting as it demonstrates the Wakashio in another trajectory from that of the 29th of July but we can also clearly distinguish the RGB (Red Green Blue) composition, an unbleached trail around the boat to the lagoon.
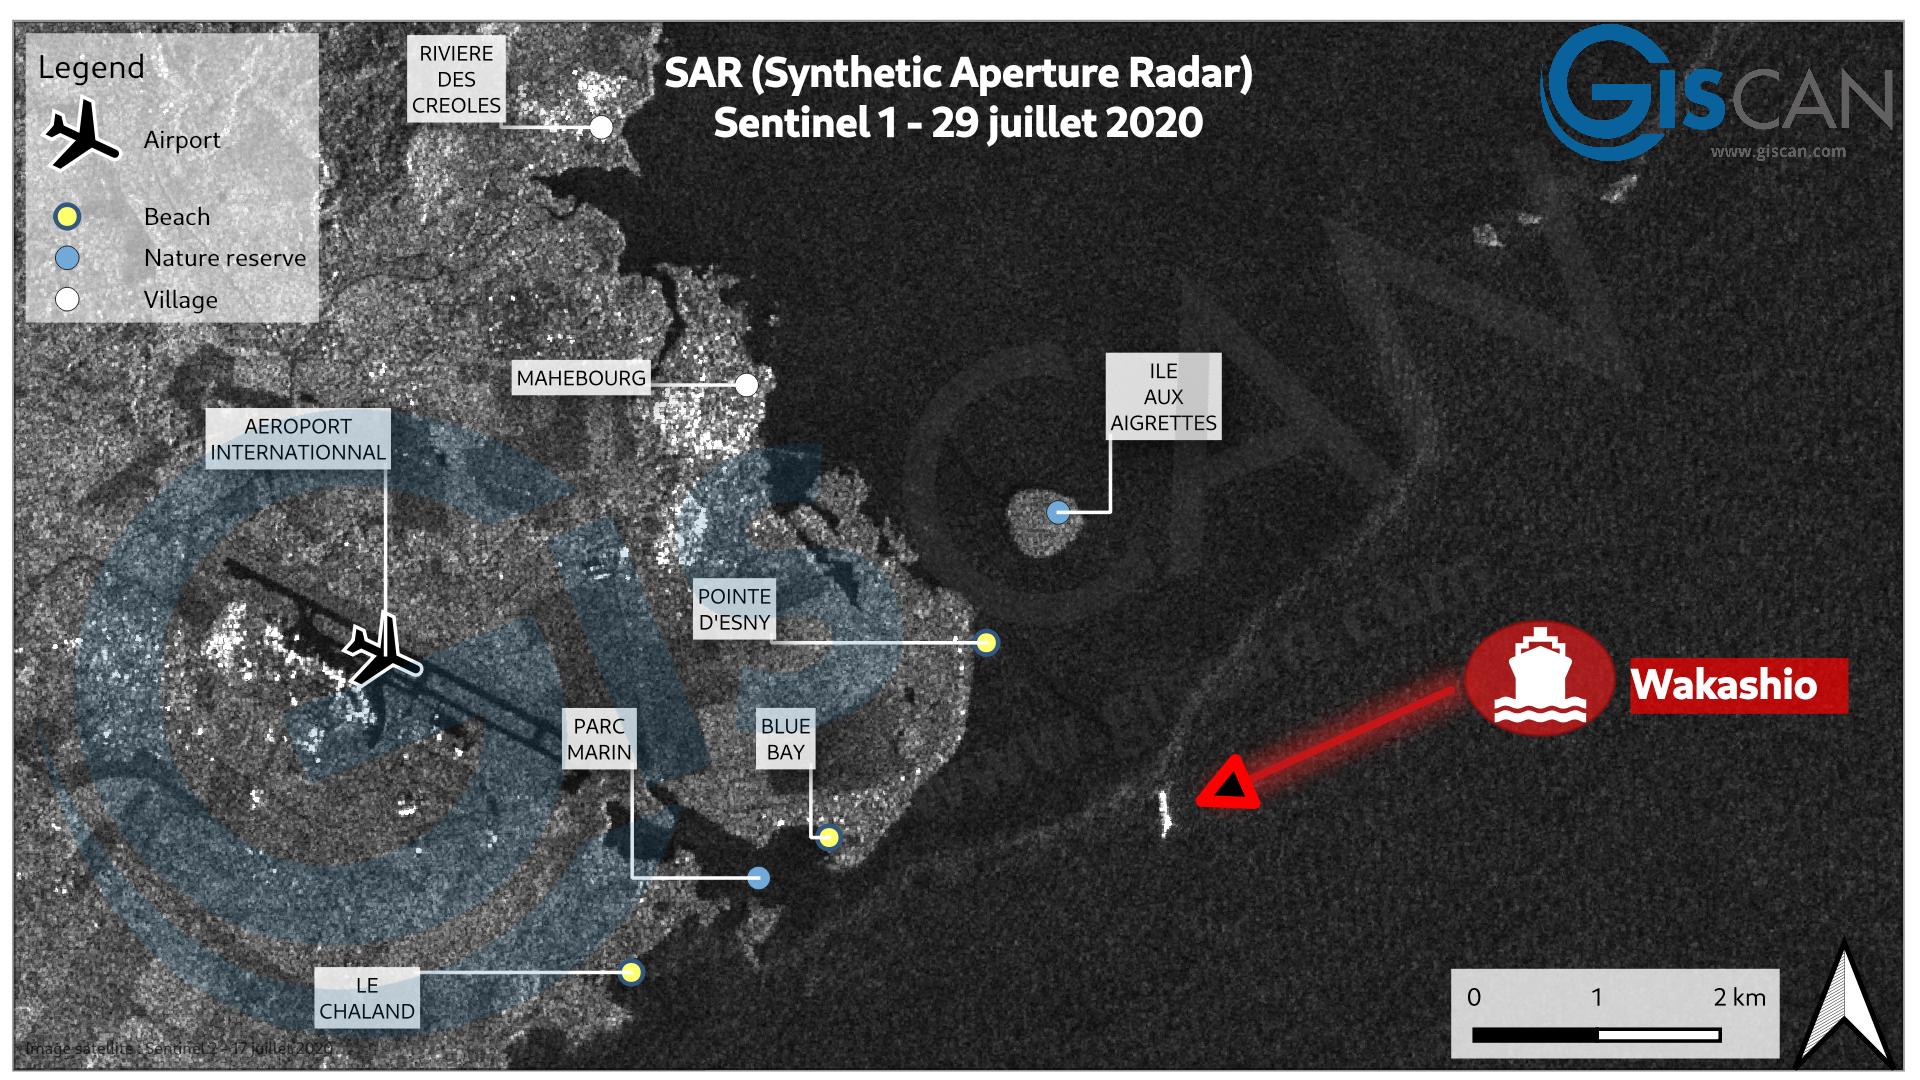
Synthetic Aperture Radar – Sentinel 1 – 29th July 2020
August 1st: The image shows a diffusion of a whitish streak. The image is not available for free and is a preview of a very high resolution (50 centimeter) satellite image that we did not acquire.
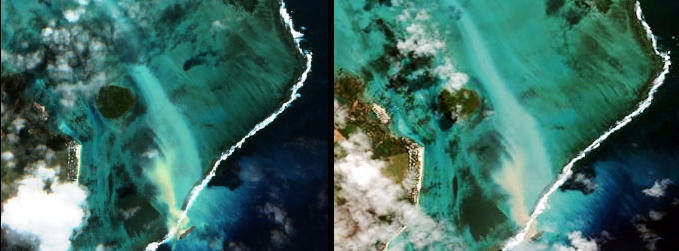
On the left: image of the July 31st 2020 Sentinel 2 ; On the right: Image GeoEye of August 1st 2020
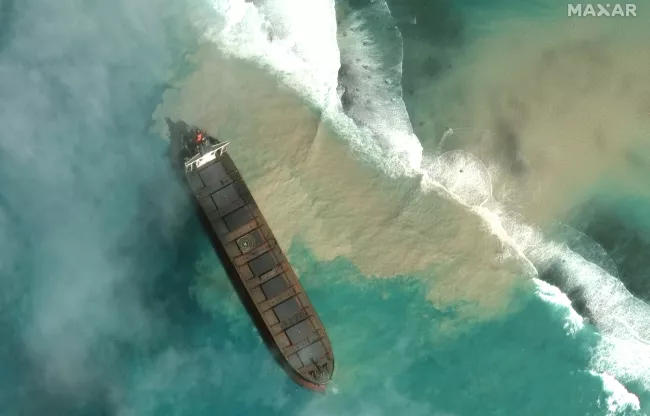
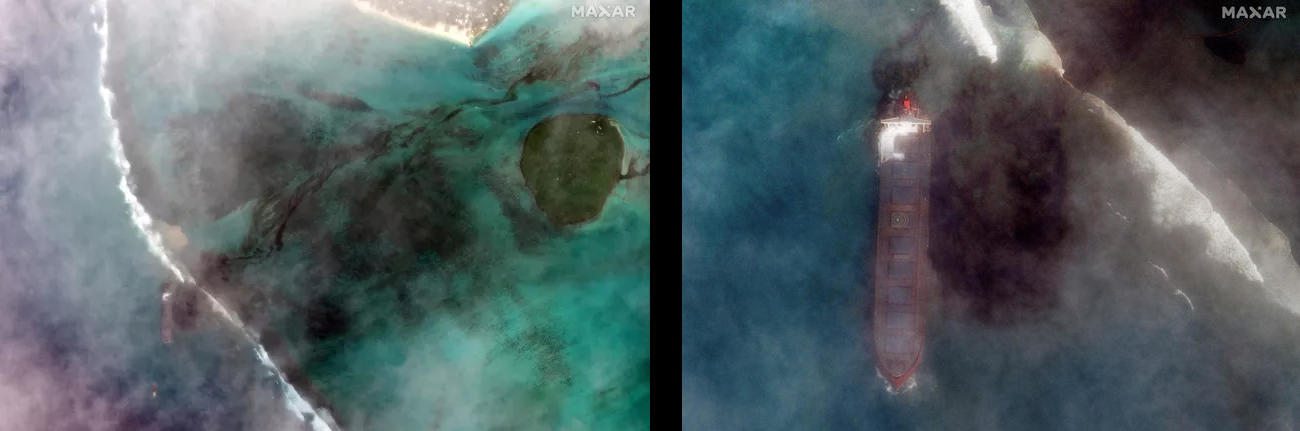
Image Maxar August 1st 2020
Our analysis of the image from the Sentinel 2 mission of July 31: Sentinel 2 produces images of 10m resolution. Having this type of data at this resolution is a great achievement. Sentinel 2 has a multi-spectral sensor with several bands in the visible and invisible light spectrum. This is its great advantage. In addition, the big added value of remote sensing is being able to create indices for the extraction of elements and analysis.
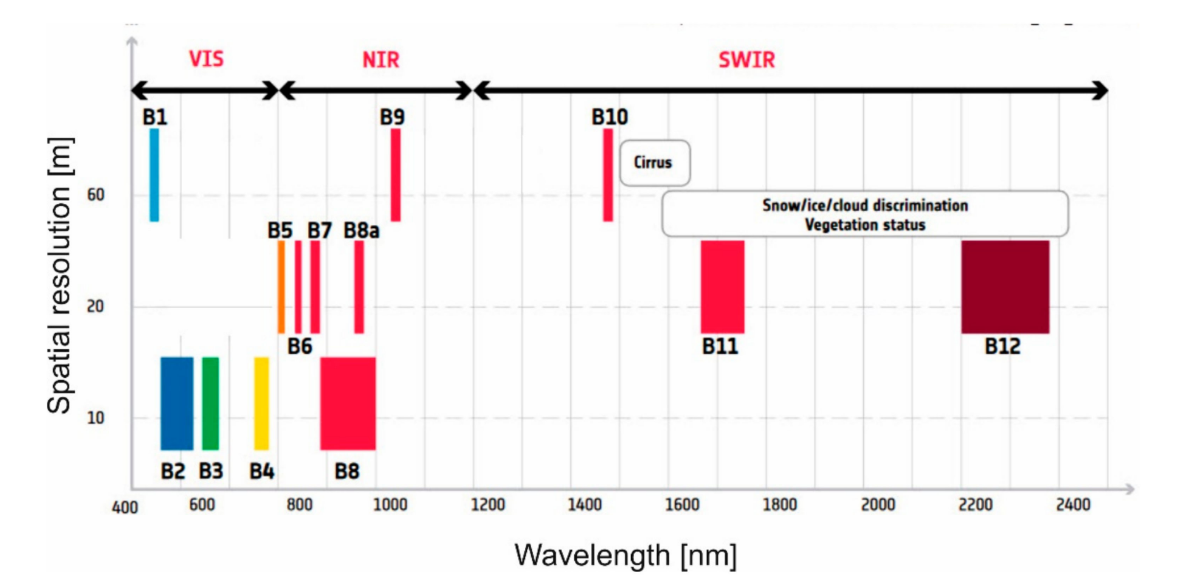
Sentinel-2 Spectral bands and resolution. Source: http://esamultimedia.esa.int/docs/EarthObservation/Sentinel-2_ESA_Bulletin161.pdf
The Normalized Difference Water Index (NDWI) was calculated from Geographic Information Systems (GIS) tools and open source remote sensing (Qgis, Grass and Orfeo toolbox among others). This index is commonly used to detect sand and as such is a clue for identifying non-water or non-vegetation elements.
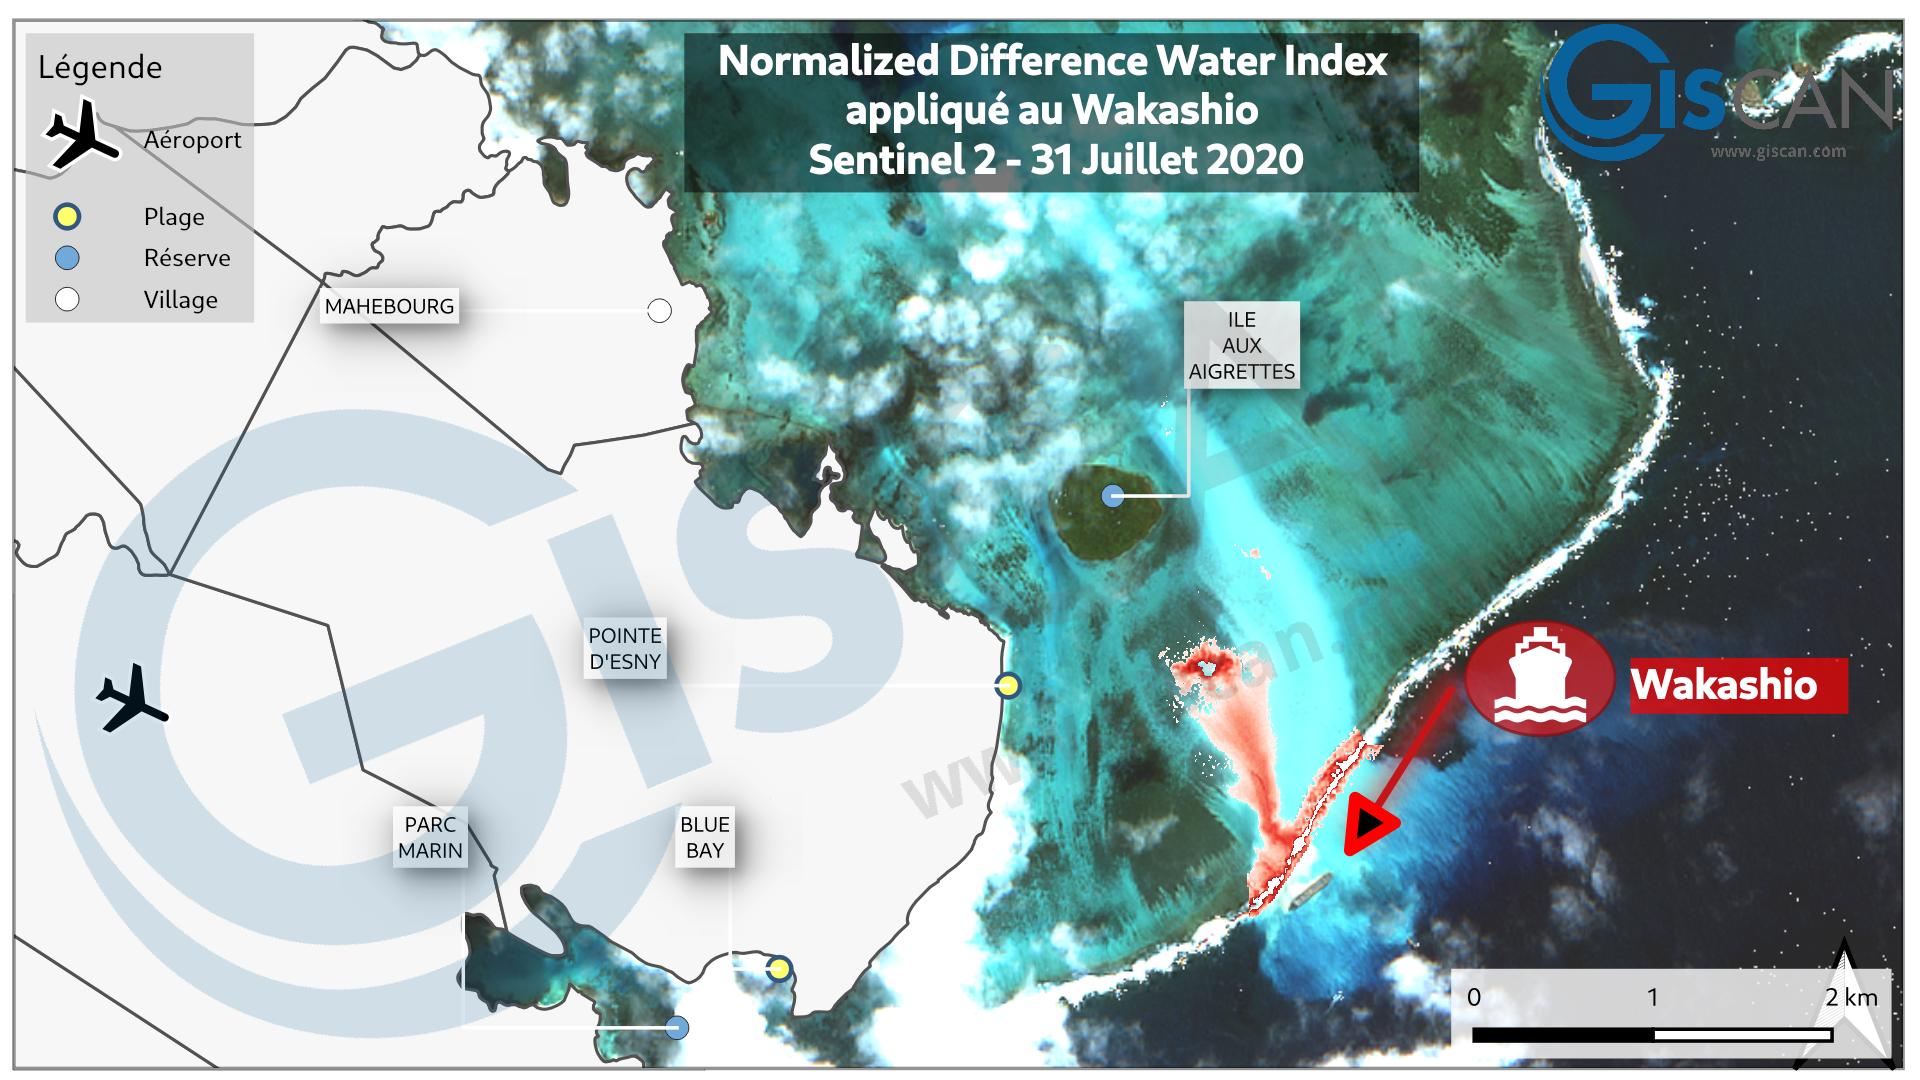
Normalized Difference Water Index applied to Wakashio
This analysis shows a plume around from the boat towards the lagoon. This plume is weaker than that visible on the RGB composition but the index makes it possible to identify a weak dilution with the lagoon water and a weak presence of vegetation. Therefore we can imagine that these are corals that have been destroyed by the boat and propagated due to the current in the lagoon.
In fact, with the analysis being carried out using GIS , we can assess the impact and the size of the coral reef affected by this very high turbidity.
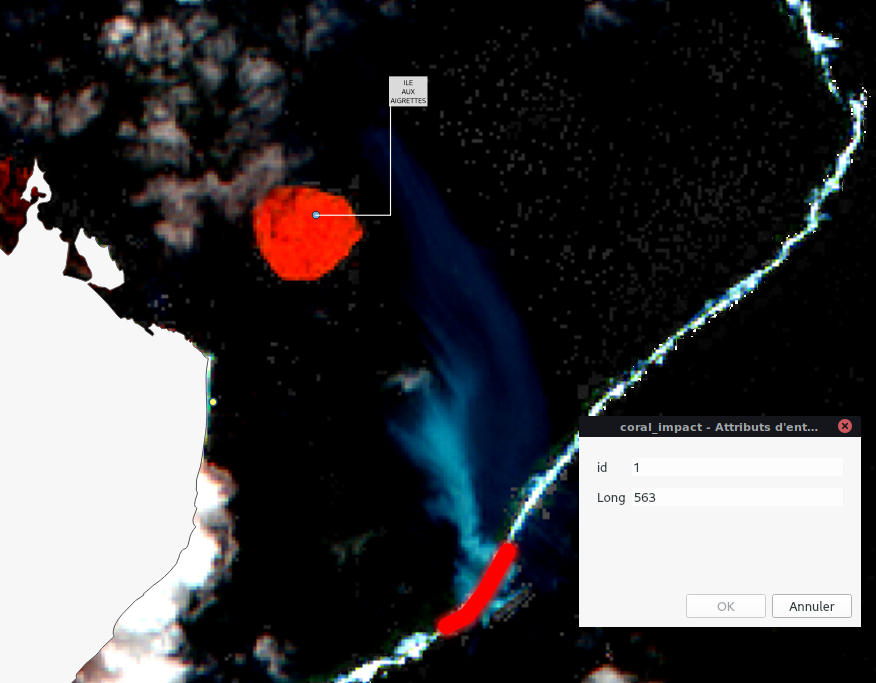
Line of corals impacted by the Wakashio. Background Sentinel 2 : false colour composition.
It is important to note that the impact on the coral reefs spans across 563 meters
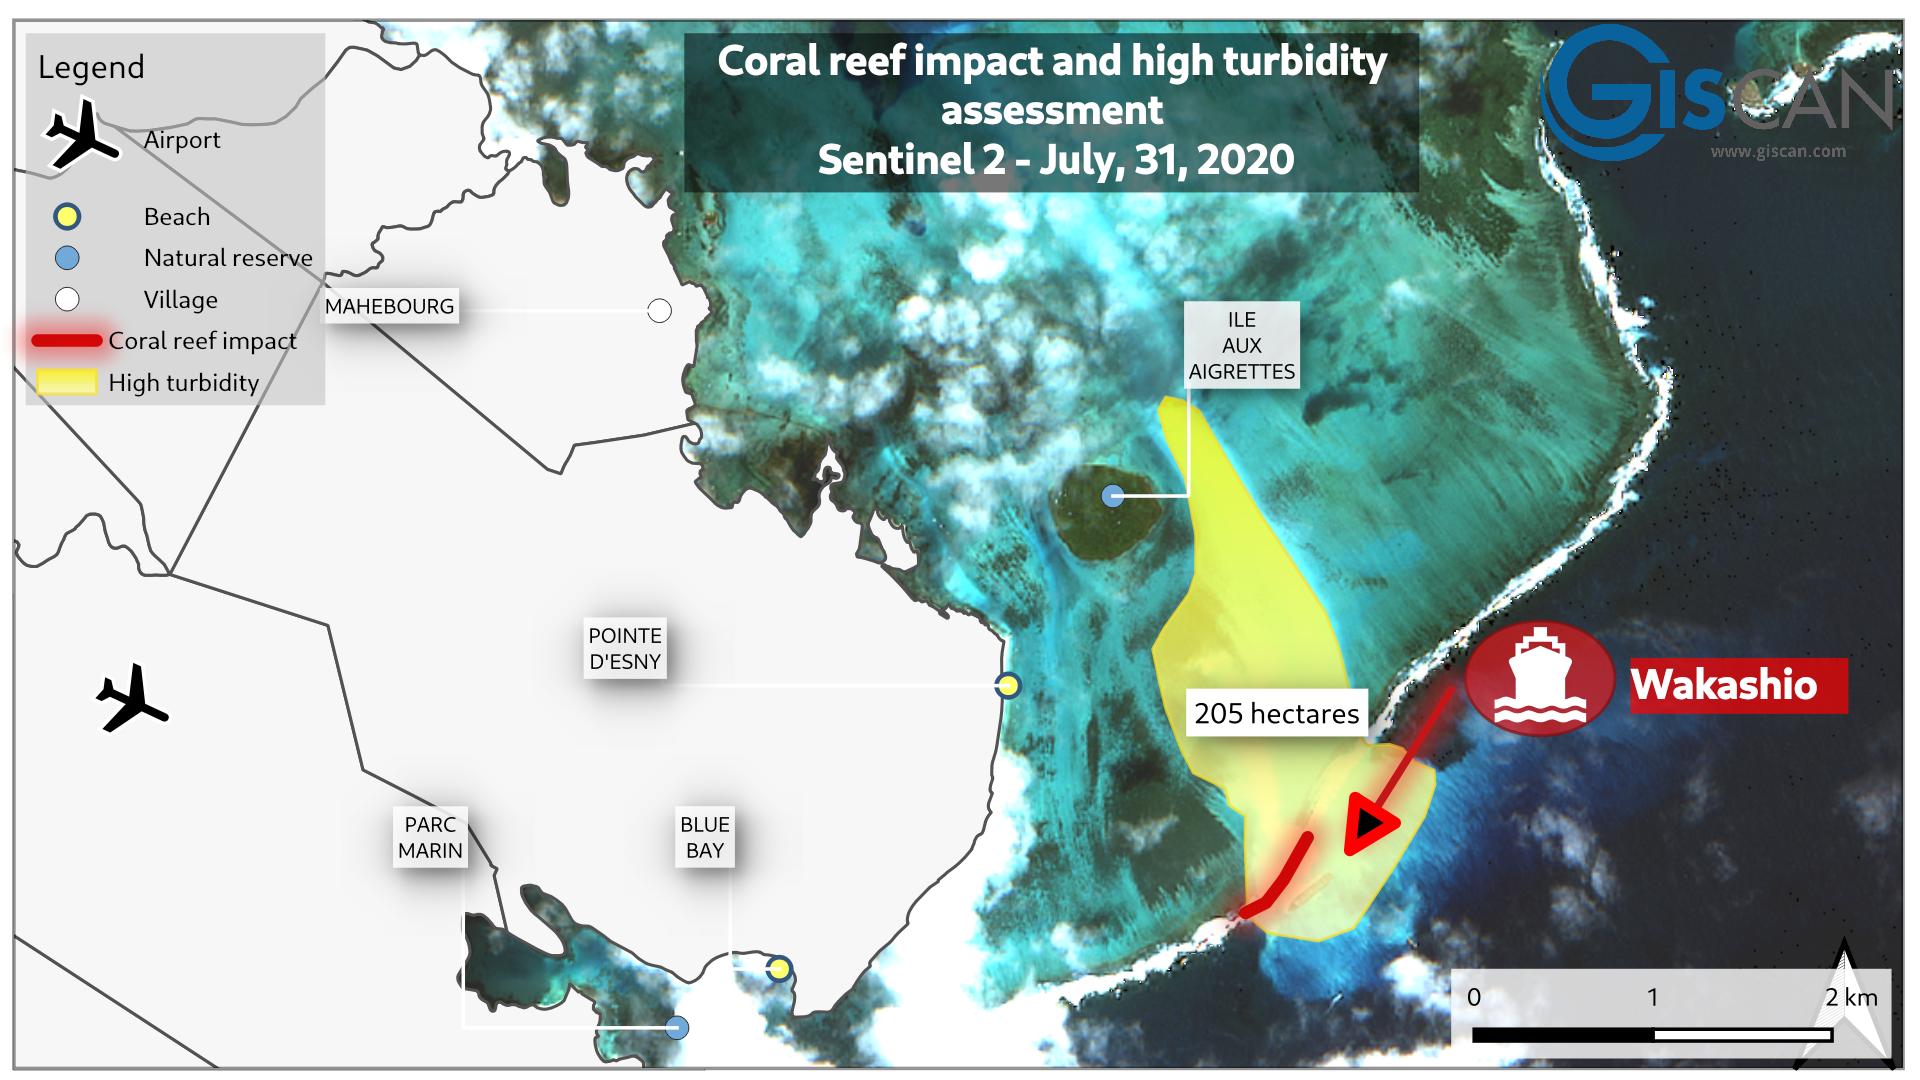
impact on corals (Wakashio’s damage on coral reef) and high turbidity impact – Sentinel 2 – July, 31st
205 hectares were affected by the diffusion of the turbidity generated by the Wakashio on July 31, 2020. Since the data of August 1st was not acquired by us, the image shows a large non-quantifiable area ( it can however this can be estimated if the scene is purchased…)
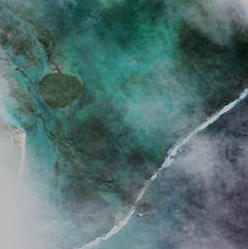
Satellite image of August 5th. Source : Planetscope.
August 5th: This image (not acquired) shows a milky lagoon before the oil spill which was caused by the crack in the hull of the ship.
August 6th: The Wakashio is cracked and the heavy oil spill visible in the Sentinel 2 image has started.
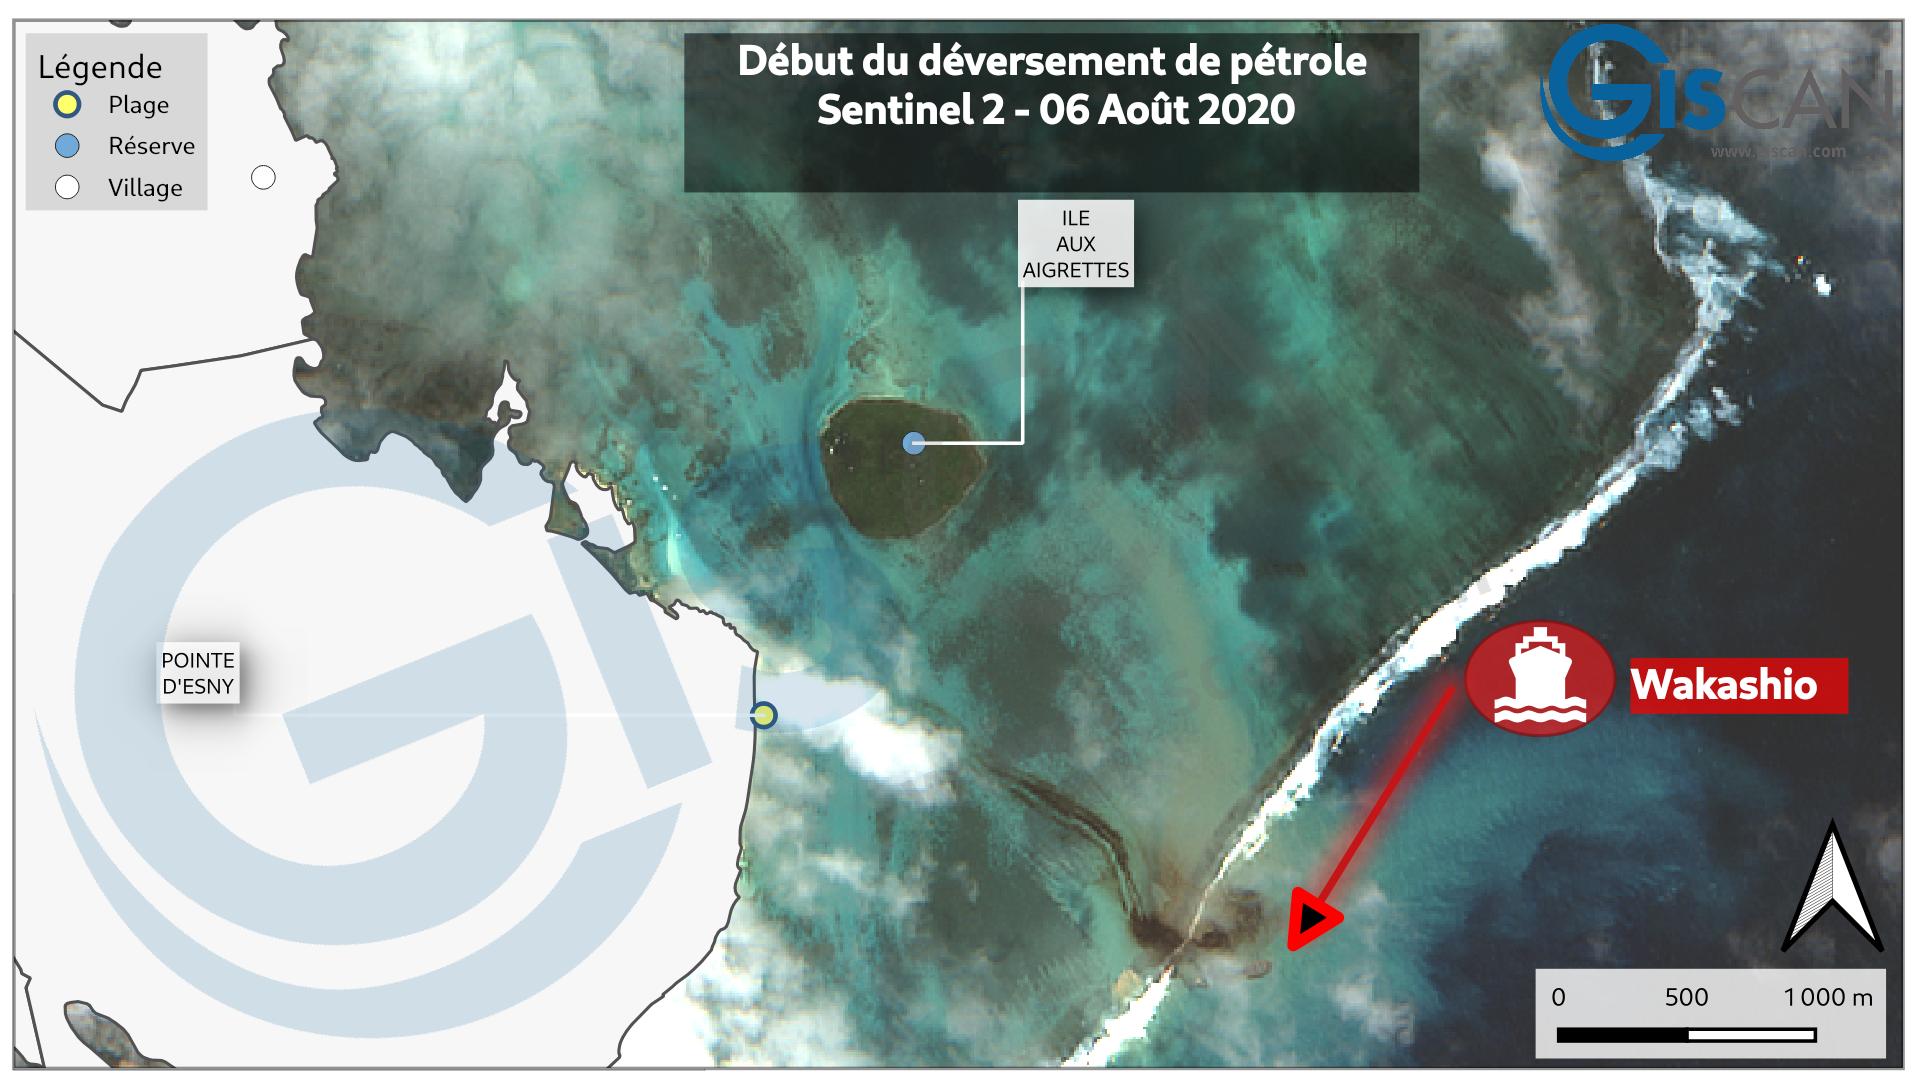
Image of August 6th 2020 10:24 Source: Sentinel 2
Worldview – 7th August 2020
August 7th: The image from Worldview is difficult to discern (due to the clouds), however, the heavy oil can be seen spreading near the Wakashio
Images posted online by Maxar, allowing for more precise identification of the evacuations of Wakashio on August 7th
 Worldview images of August 8th. Images for pansharpening treatment, while not very useful in analysis, we can still distinguish traces of oil.
August 8th: Glimpse of fuel oil on the image used for usual pansharpening.
August 9th: The image has too many clouds. Unsurprisingly, the heavy oil follows the same path as the whitish streaks seen previously. The south-easterly flow (trade winds) present in Mauritius corresponds, apart from local variations due to bathymetry and tides, to the displacement of sediments and heavy oil. This displacement is also visible on the France weather forecast:
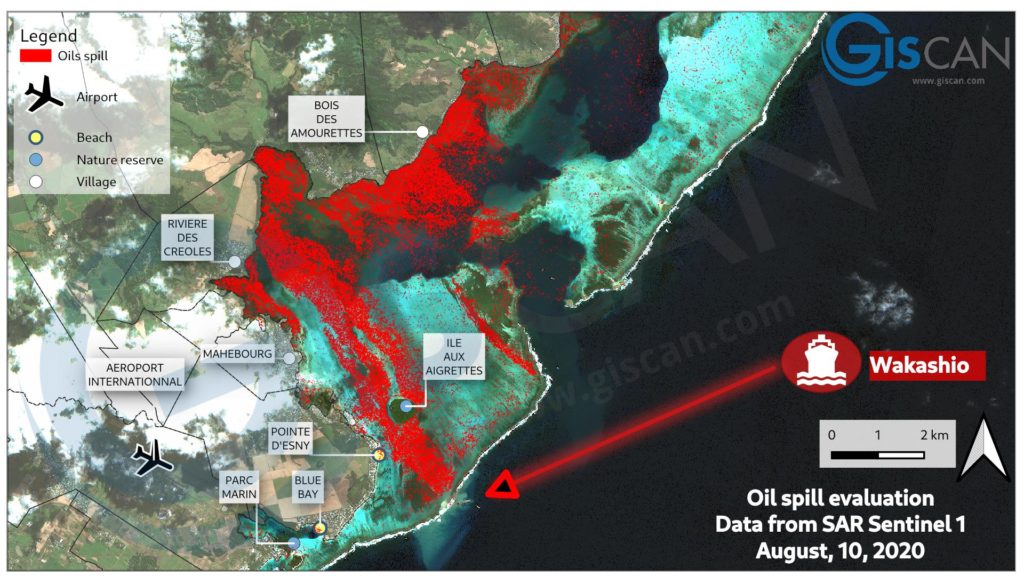
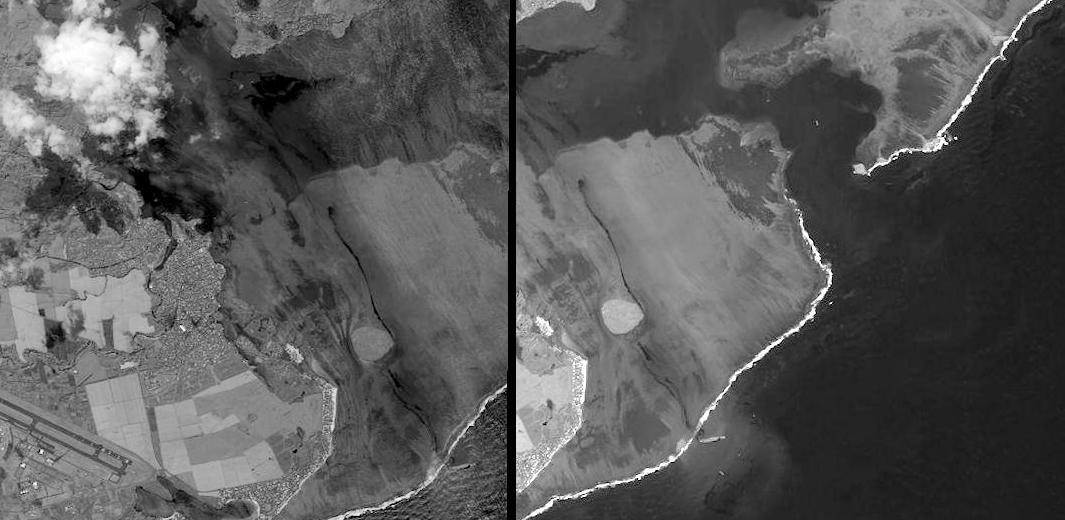
August 10th : The SAR (Synthetic Aperture Radar image – Sentinel 1) shows the extent of the oil spill in the lagoon. The darker black colour represents the heavy oil spilled into the lagoon.
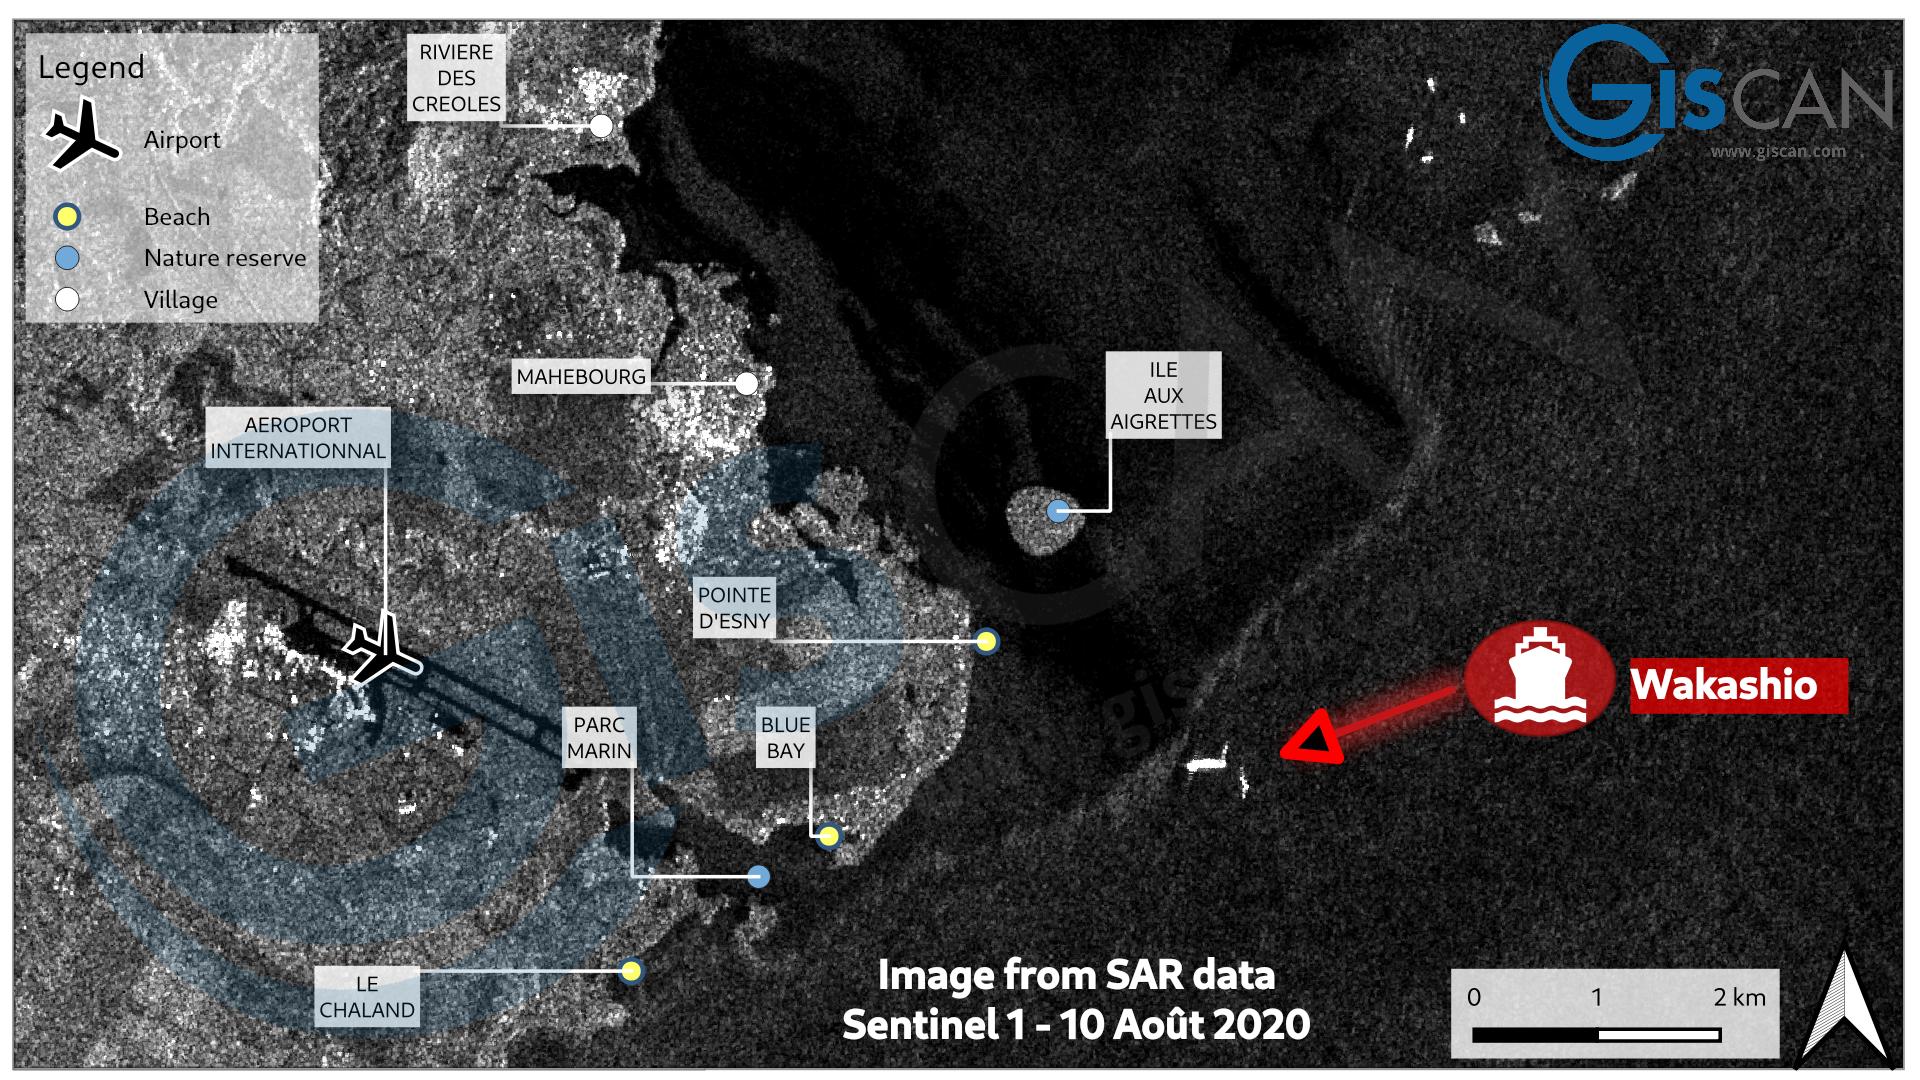
Image taken from Sentinel 1 SAR data – August 10, 2020

Oil spill evaluation – Data from SAR Sentinel 1. August, 10, 2020
Note that while this image may seem alarmist, as it detects any release of oil, including that invisible to the naked eye, which could suggest that the water is clean. 2125 hectares covered with a film of (usually quite thin) oil
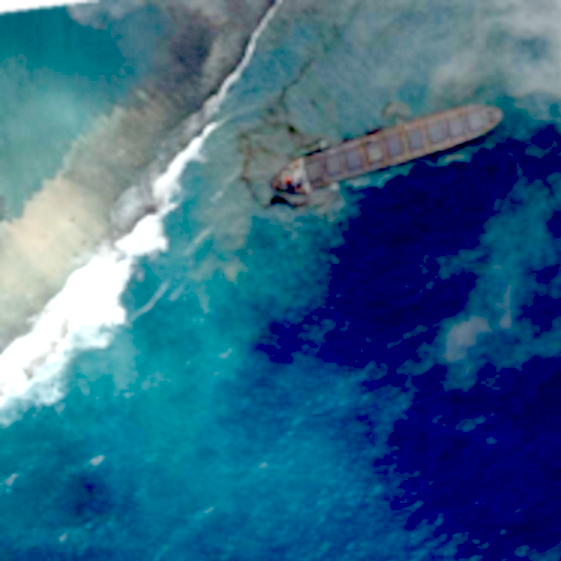
Image Skysat of August 10th
The Skysat image of the 10th of August shows that the Wakashio is leaning heavily backwards surrounded by fuel oil. August 11th: Very clear image of a cloudless lagoon, quite exceptional.

Mauritius South East lagoon sentinel 2 satellite image -August 11th 2020
Sentinel imagery from August 2nd to August 10th near Bois des Amourettes with clear visual of the floaters built by the volunteers
Note: We can analyze the image of August 11th or auto-detect petroleum or heavy oil with semi-automated analysis. Here’s a quick model:
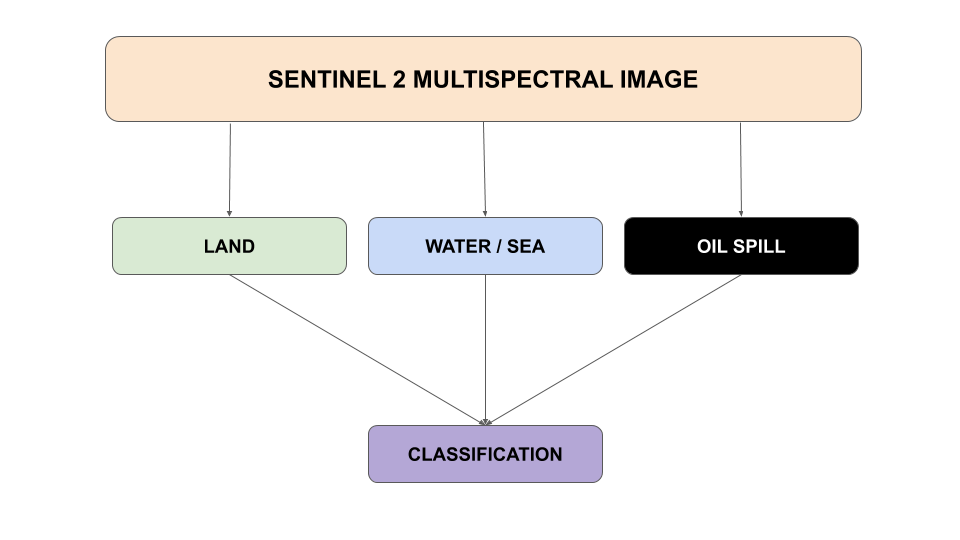
Fuzzy classification using OBIA (object based image analysis) method
Here is the result which makes it possible to detect more or less dense variations in heavy oils or petroleum:
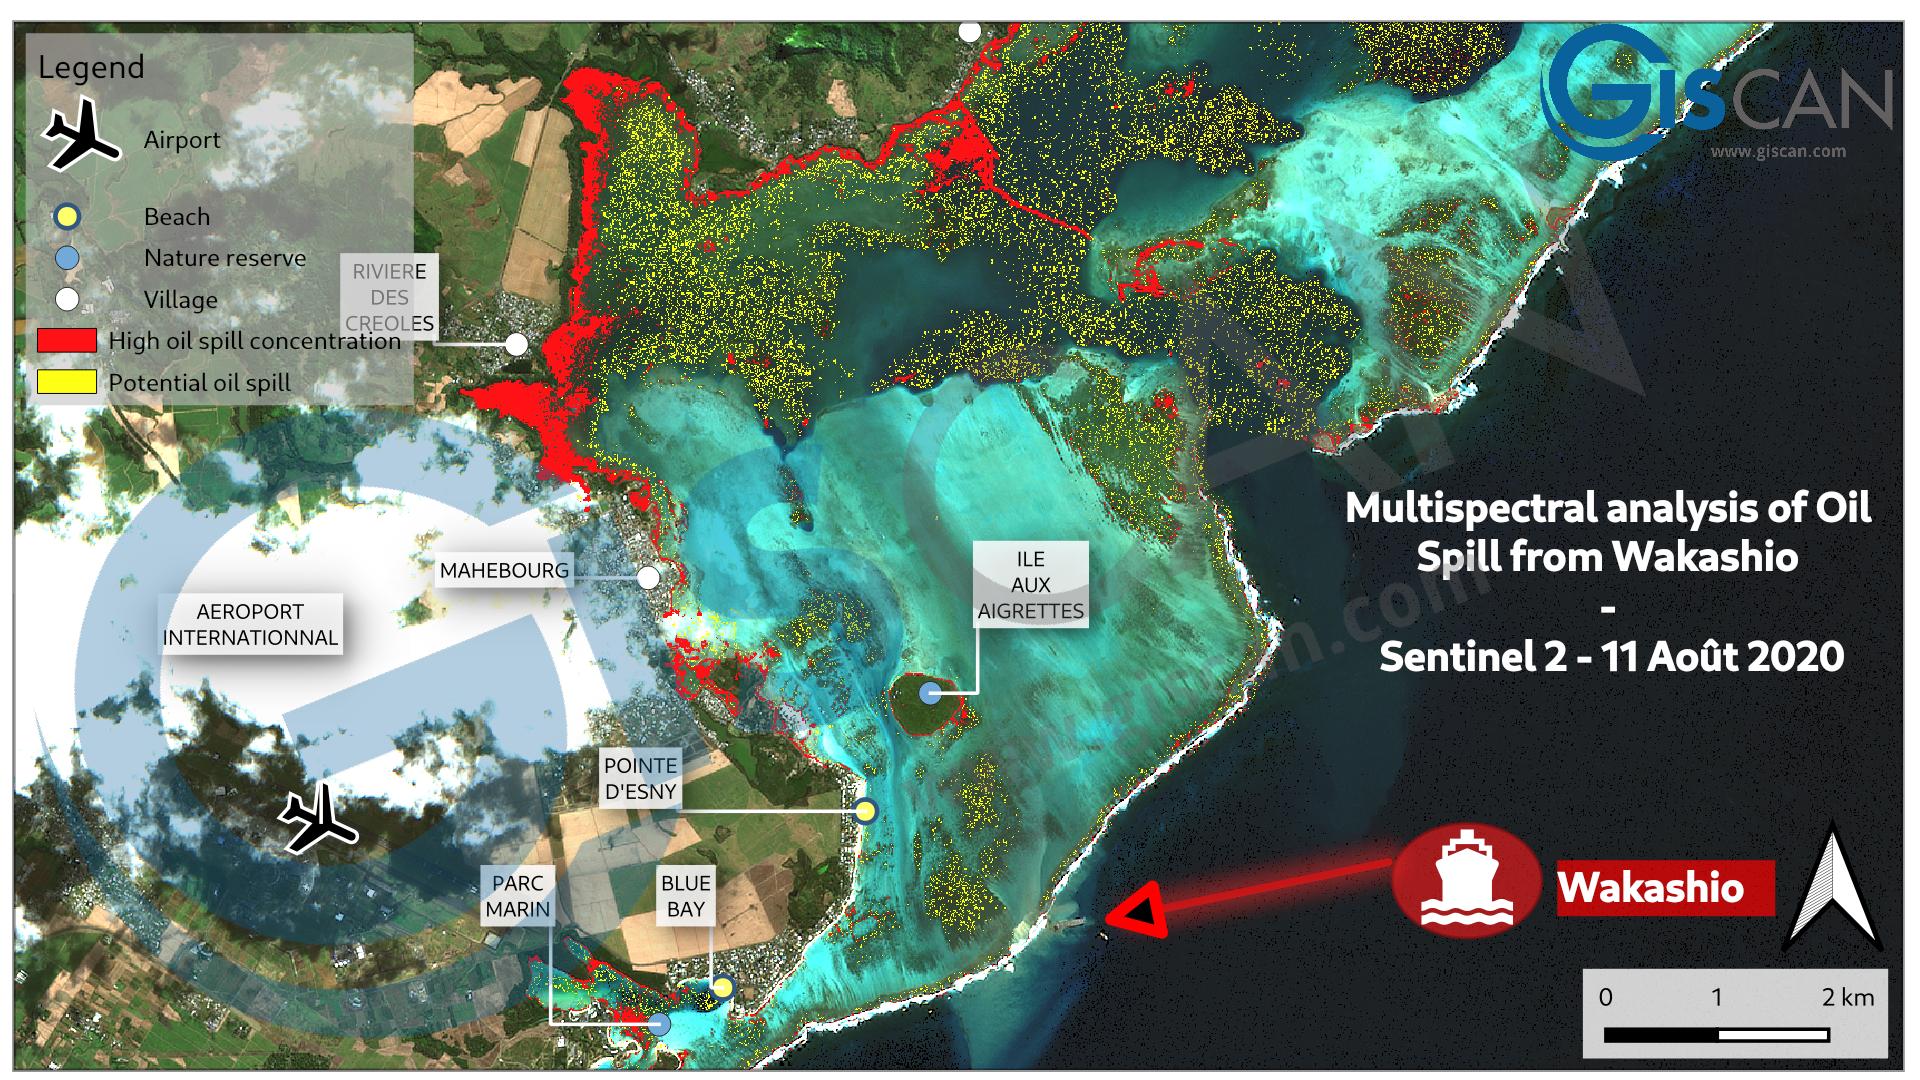
Multispectral analysis of Wakashio oil spill – Sentinel 2 –August 11th 2020
Conclusion :
It is therefore possible to follow the evolution of a ship stranded on the coral reef and assess its short-term impact. The assessment presented here is rapid. Further assessment is possible with our multi-spectral drone. Apart from its quality of capturing high resolution images, the drone in a tropical environment makes it possible to overcome potentially present clouds. Thus, satellite image search was often subject to the presence of significant cloud cover.
In this unprecedented situation, the entire GISCAN team is mobilized to analyze the evolution of the situation.
For more information, contact us at : contact@giscan.com